Common Core and Math in Sixth Grade
In sixth grade, students will focus on four areas: (1) connect ratio and rate to whole number multiplication and division and use concepts of ratio and rate to solve problems; (2) complete understanding of division of fractions and extending the notion of number to the system of rational numbers, including negative numbers; (3) write, interpret, and use expressions and equations; and (4) develop understanding of statistical thinking.
Students will understand ratio concepts and use ratio and rate reasoning to solve real-world and mathematical problems by reasoning about tables of equivalent ratios, tape diagrams, double number line diagrams, or equations.
Students will make tables of equivalent ratios relating quantities with whole-number measurements, find missing values in the tables, and plot the pairs of values on the coordinate plane. They will use tables to compare ratios.
Students will solve unit rate problems including those involving unit pricing and constant speed.
Students will find a percent of a quantity as a rate per 100 (30% of a quantity means 30/100 times the quantity); solve problems involving finding the whole, given a part and the percent.
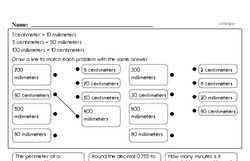
Students will use ratio reasoning to convert measurement units and manipulate and transform units appropriately when multiplying or dividing quantities.
Students will apply and extend previous understandings of multiplication and division to divide fractions by fractions. They will interpret and compute quotients of fractions, and solve word problems involving division of fractions by fractions by using visual fraction models and equations to represent the problem.
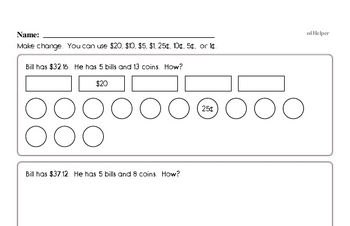
Students will fluently add, subtract, multiply, and divide multi-digit decimals and find common factors and multiples of two whole numbers. They will apply and extend previous understandings of numbers to the system of rational numbers. Students will understand that positive and negative numbers are used together to describe quantities having opposite directions or values (temperature above/below zero), and they will use positive and negative numbers to represent quantities in real-world contexts, explaining the meaning of 0 in each situation.
Students will understand a rational number as a point on the number line, recognizing opposite signs of numbers as indicating locations on opposite sides of 0 on the number line.
They will understand signs of numbers in ordered pairs as indicating locations in quadrants of the coordinate plane, and they will recognize that when two ordered pairs differ only by signs, the locations of the points are related by reflections across one or both axes.
Students will find and position integers and other rational numbers on a horizontal or vertical number line diagram and find and position pairs of integers and other rational numbers on a coordinate plane.
Students will understand ordering and absolute value of rational numbers and interpret statements of inequality as statements about the relative position of two numbers on a number line diagram (interpret -3 > -7 as a statement that -3 is located to the right of -7 on a number line oriented from left to right).
Students will solve real-world and mathematical problems by graphing points in all four quadrants of the coordinate plane.
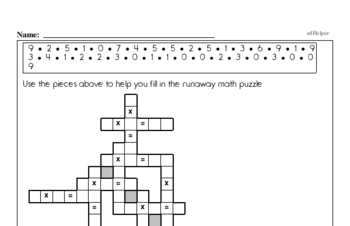
Apply and extend previous understandings of arithmetic to algebraic expressions; they will write, read, and evaluate expressions in which letters stand for numbers. Students will evaluate expressions at specific values of their variables. Students will apply the properties of operations to generate equivalent expressions. (For example, apply the distributive property to the expression 3 (2 + x) to produce the equivalent expression 6 + 3x).
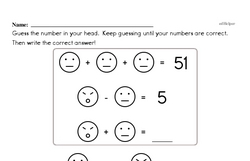
Students will reason about and solve one-variable equations and inequalities and use substitution to determine whether a given number in a specified set makes an equation or inequality true.
Students will use variables to represent numbers and write expressions when solving a real-world or mathematical problem and understand that a variable can represent an unknown number.
Students will use variables to represent two quantities in a real-world problem that change in relationship to one another; write an equation to express one quantity, thought of as the dependent variable, in terms of the other quantity, thought of as the independent variable. They will analyze the relationship between the dependent and independent variables using graphs and tables, and relate these to the equation. For example, in a problem involving motion at constant speed, list and graph ordered pairs of distances and times, and write the equation d = 65t to represent the relationship between distance and time.
Students will solve real-world and mathematical problems involving area, surface area, and volume. They will draw polygons in the coordinate plane given coordinates for the vertices and use coordinates to find the length of a side joining points with the same first coordinate or the same second coordinate. They will apply these techniques to solve real-world and mathematical problems.
Students will represent three-dimensional figures using nets made up of rectangles and triangles, and use the nets to find the surface area of these figures. They will apply these techniques to solve real-world and mathematical problems.
Students will develop understanding of statistical variability. They will recognize a statistical question as one that anticipates variability in the data related to the question and accounts for it in the answers. For example, "How old am I?" is not a statistical question, but "How old are the students in my school?" is a statistical question because one anticipates variability in students' ages. Students will understand that a set of data collected to answer a statistical question has a distribution which can be described by its center, spread, and overall shape.
Students will recognize that a measure of center for a numerical data set summarizes all of its values with a single number, while a measure of variation describes how its values vary with a single number.
Students will display numerical data in plots on a number line, including dot plots, histograms, and box plots. They will summarize numerical data sets in relation to their context, such as by reporting the number of observations, describing the nature of the attribute under investigation, including how it was measured and its units of measurement, give quantitative measures of center (median and/or mean) and variability (interquartile range and/or mean absolute deviation), as well as describing any overall pattern and any striking deviations from the overall pattern with reference to the context in which the data were gathered. Students will relate the choice of measures of center and variability to the shape of the data distribution and the context in which the data were gathered.