
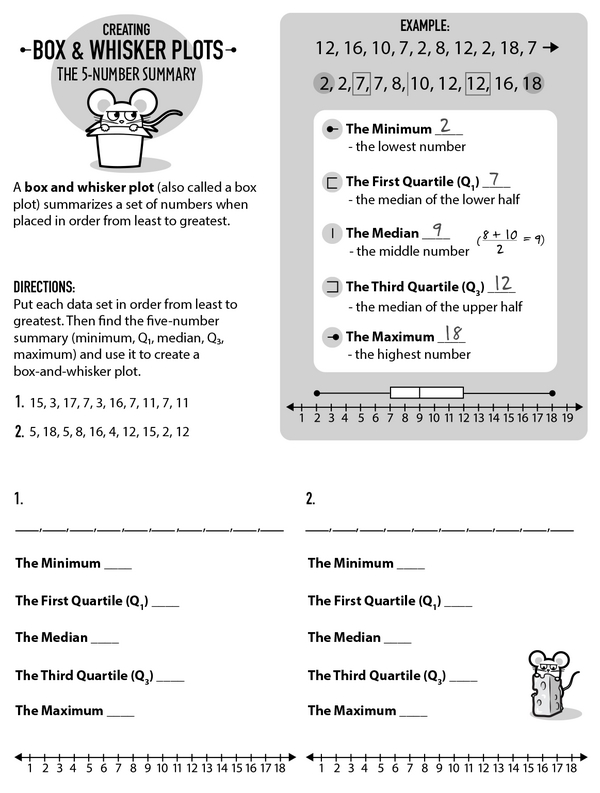
Want to make sense of a set of random numbers? A box and whisker plot, or box plot, can help you do just that! Study the example carefully, then complete the challenge.
A box and whisker plot is a graph that helps you understand a data set quickly. First, put the data in order and find the median. If there is an odd number of values, the median is the middle number. If there is an even number of values, the median is the average of the two middle numbers. Next, find the first quartile (Q1) and third quartile (Q3) by finding the medians of the lower and upper halves of the data. Then draw a box from Q1 to Q3, with a line inside the box to show the median. The whiskers show how far the data stretches, from the minimum to the maximum. Now that you know how it works, try solving two on your own.
Data Explorers: Creating Box and Whisker Plots
Data Explorers: Creating Box and Whisker Plots
GRADES:

Additional Educational Resources:
Data Large Workbook - (Grade 6)
Statistics Large Workbook - (Grade 6)
Interquartile Range Explained: The Middle Spread
Monster Math Mayhem: Absolute and Opposite Values
Decimals in Action: How to Write and Say Them
Say No to Remainders: GCF to the Rescue