
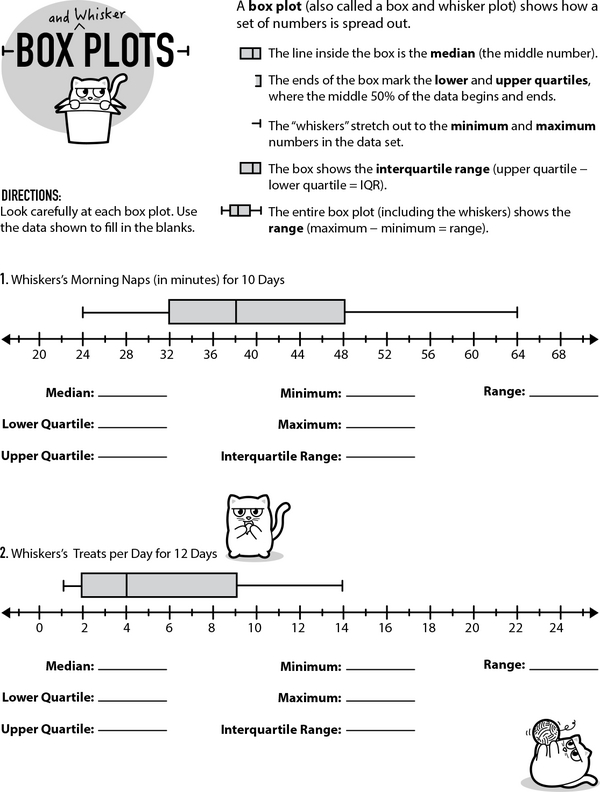
Have a lot of data and want a simple way to show the minimum, maximum, median, lower and upper quartiles, and interquartile range? Box plots (or box and whisker plots) are exactly what you need! Check out the quick guide, then complete the activity.
Data in a Box: Unboxing Box Plots
Data in a Box: Unboxing Box Plots
GRADES:

Additional Educational Resources:
Data Large Workbook - (Grade 6)
Statistics Large Workbook - (Grade 6)
Decimals Addition and Subtraction: Line up and Solve
Multiply the Mix: Fractions in Action
Mystery Numbers: Mean and Mode to the Rescue
Primes Only: Chasing Numbers in the Wild