
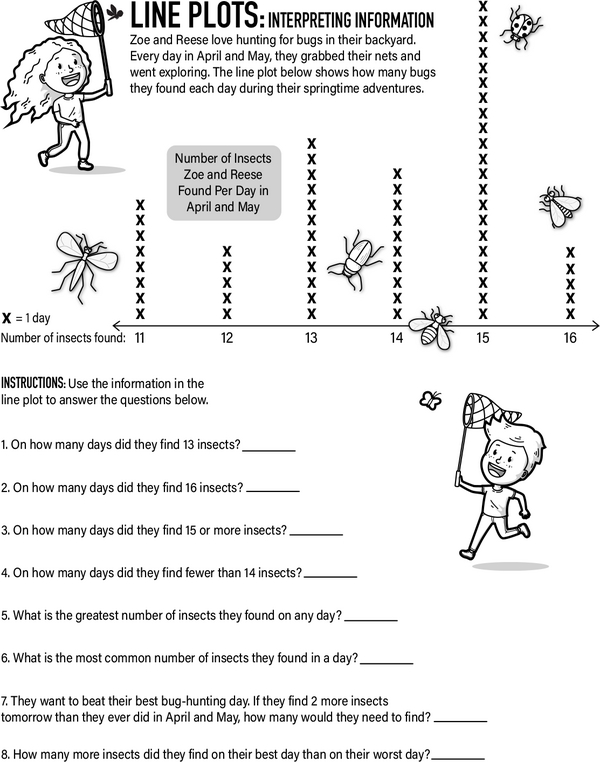
Zoe and Reese have been busy catching bugs in their backyard. They use a line plot to track their results. Study the graph carefully, then answer the questions.
A line plot shows how many times something happens by using Xs or dots above a number line. Each X stands for one piece of data. This type of visual display helps you understand information and spot patterns easily. Let's see what Zoe and Reese are trying to show you!
Graph It Out: Exploring Line Plots
Additional Educational Resources:
Shapes and Patterns Large Workbook - (Grade 2)
Picture Graphs Large Workbook - (Grade 2)
Quick Assessment - Geometry Puzzles: Exploring Shape Patterns
Learning Place Value through Descending Number Sorting
A Deep Dive into Pictographs: Granny's Garden
Fractions Mania: Comparing and Ordering Fractions
Crayon Math: Subtract and Shade
Time to Tell: Tick-Tock Challenge
Cinco de Mayo Addition and Subtraction Challenge
Graph It Out: Exploring Line Plots
GRADES:
Additional Educational Resources:
Shapes and Patterns Large Workbook - (Grade 2)
Picture Graphs Large Workbook - (Grade 2)
Quick Assessment - Geometry Puzzles: Exploring Shape Patterns
Learning Place Value through Descending Number Sorting
A Deep Dive into Pictographs: Granny's Garden
Fractions Mania: Comparing and Ordering Fractions
Crayon Math: Subtract and Shade
Time to Tell: Tick-Tock Challenge
Cinco de Mayo Addition and Subtraction Challenge