
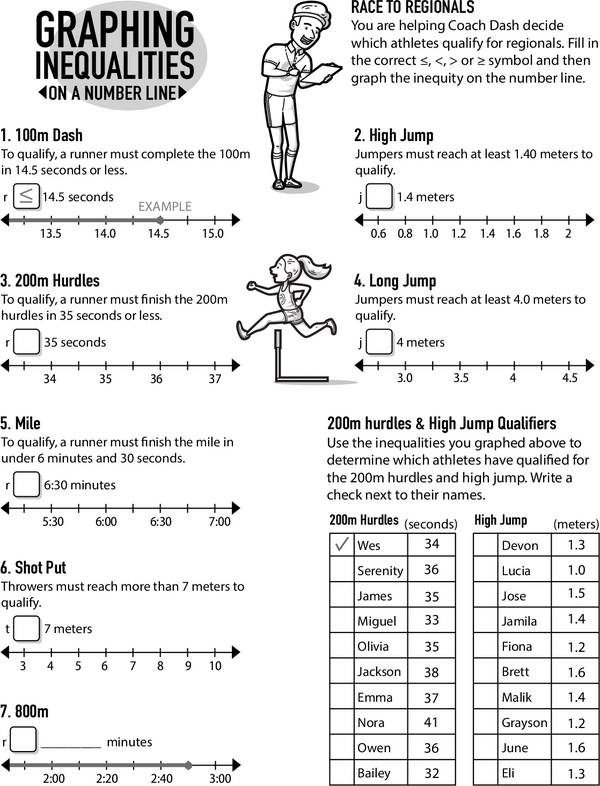
This worksheet is designed to help students practice graphing inequalities on number lines. Students will assist Coach Dash in determining which athletes qualify for regionals by graphing seven inequalities. Then, they will use a table to identify which athletes met the 200m hurdles and high jump events criteria. This task reinforces their understanding of inequalities and helps them develop data interpretation and critical thinking skills as they identify and record potential values satisfying given conditions.
Graphing Inequities on a Number Line: A Student's Guide to Inequalities and Analysis
Additional Educational Resources:
Equations and Inequalities Large Workbook - (Grade 6)
Number Lines and Negative Numbers Large Workbook - (Grade 6)
Quick Assessment - Mastering Percent Calculations: Real-World Percents
Mastering Ratios: Completing and Identifying Equivalent Ratios
Mapping Pepper's Snack Hunt: Learn Coordinates on a Grid
Egg-sploding Fractions: Improper Fractions and Mixed Numbers
Understanding Exponents: Key Terms and Practice for Students
Graphing Inequities on a Number Line: A Student's Guide to Inequalities and Analysis
GRADES:

Additional Educational Resources:
Equations and Inequalities Large Workbook - (Grade 6)
Number Lines and Negative Numbers Large Workbook - (Grade 6)
Quick Assessment - Mastering Percent Calculations: Real-World Percents
Mastering Ratios: Completing and Identifying Equivalent Ratios
Mapping Pepper's Snack Hunt: Learn Coordinates on a Grid
Egg-sploding Fractions: Improper Fractions and Mixed Numbers
Understanding Exponents: Key Terms and Practice for Students