
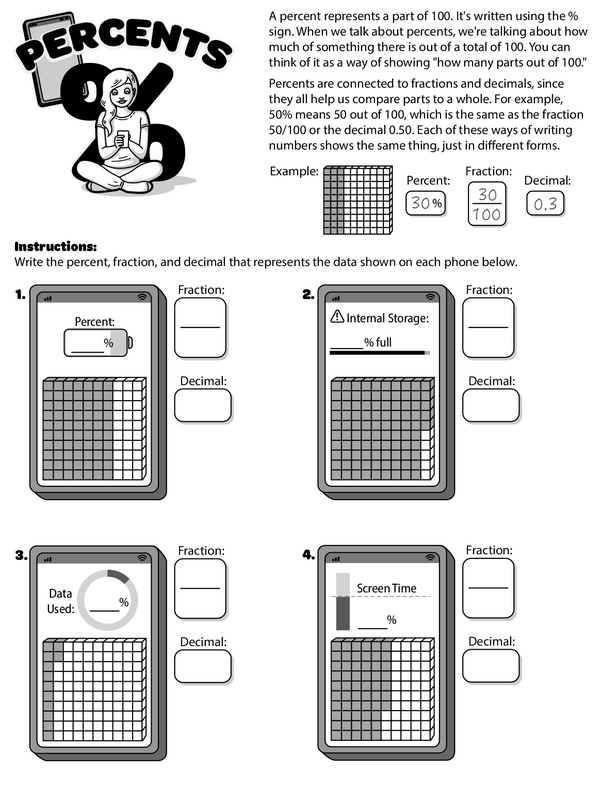
Students are tasked with identifying the percent, fraction, and decimal representations depicted on four mobile phone images. A graph containing 100 boxes appears on each phone, highlighting a portion. Students must calculate the percentage of the colored boxes and then translate it into a fraction and a decimal. The example shows a big graph with 100 boxes, and 30 of them are colored. The "percent" tells us how many out of 100 boxes are colored. Since 30 out of 100 are colored, that's 30 percent, or 30%. To turn this into a fraction, you take the colored boxes (30) over the total boxes (100), which is written as 30/100. This can be simplified to 3/10 by dividing 30 and 100 by 10. For a decimal, you divide 30 by 100, which gives you 0.30. So, 30%, 30/100, and 0.30 all show the exact amount.
Mastering Percentages: A Hands-On Approach with Phones
Additional Educational Resources:
Percents Large Workbook - (Grade 6)
Fractions and Decimals Large Workbook - (Grade 6)
Quick Assessment - Pieces of 100 Percent Adventure: Mastering Percents, Decimals & Fractions
Quick Assessment - Decimal Fluency: Real-Life Word Problems and Operations
Mapping Pepper's Snack Hunt: Learn Coordinates on a Grid
Converting and Comparing Metric Units
Mastering the Order of Operations: An introduction to PEMDAS
Solving Decimal Division
Mastering Percentages: A Hands-On Approach with Phones
GRADES:
Additional Educational Resources:
Percents Large Workbook - (Grade 6)
Fractions and Decimals Large Workbook - (Grade 6)
Quick Assessment - Pieces of 100 Percent Adventure: Mastering Percents, Decimals & Fractions
Quick Assessment - Decimal Fluency: Real-Life Word Problems and Operations
Mapping Pepper's Snack Hunt: Learn Coordinates on a Grid
Converting and Comparing Metric Units
Mastering the Order of Operations: An introduction to PEMDAS
Solving Decimal Division