
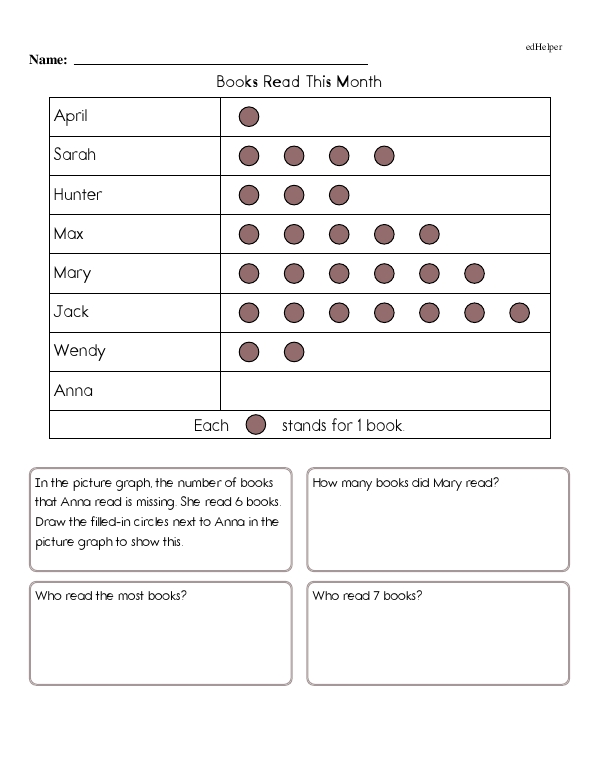
"Reading Graphs and Answering Data Word Problems" features single worksheet pages with a simple graph at the top. Each graph lists the names of students on the left and markers on the right to represent how many books they read or how much money they earned babysitting. A key at the bottom tells students that each indicator is worth a value of one. For example, one filled-in circle stands for one book.
Underneath the graph is a series of questions. They ask things like:
* How many books did a certain student read?
* Who read the fewest books?
* How much more money did one student earn compared to another?
* How much did two students spend at the mall if they spent all their money?
Some pages also ask students to fill in parts of the graph. For example, one question might tell students about the number of books that a specific student read and ask them to draw circles in the graph to represent that amount.
Reading graphs is an important skill for students to learn. It helps them visualize and compare data, and it supports problem-solving and decision-making.
Even very young students can be asked to read a simple graph with images that represent things like the number of books read or money earned from chores. These types of graphs can be completed by students during class, giving students real-world data. For example, each student could start with a blank graph and ask their classmates what their favorite color is. Students can then answer questions about the data, like what color is the most popular and how many more students like one color than another.
Once students get used to reading data on simple graphs, they can transition to reading data on completed graphs. You can use this as a warmup before a larger math lesson or assign it as homework so students can get additional practice before a test.
Reading Graphs and Answering Data Word Problems
Reading Graphs and Answering Data Word Problems
GRADES:
Additional Educational Resources:
Picture Graphs and Bar Graphs Large Workbook - (Grade 1)
Money Large Workbook - (Grade 1)
Quick Assessment - Discover Graphs: Picture Graphs and Bar Graphs