
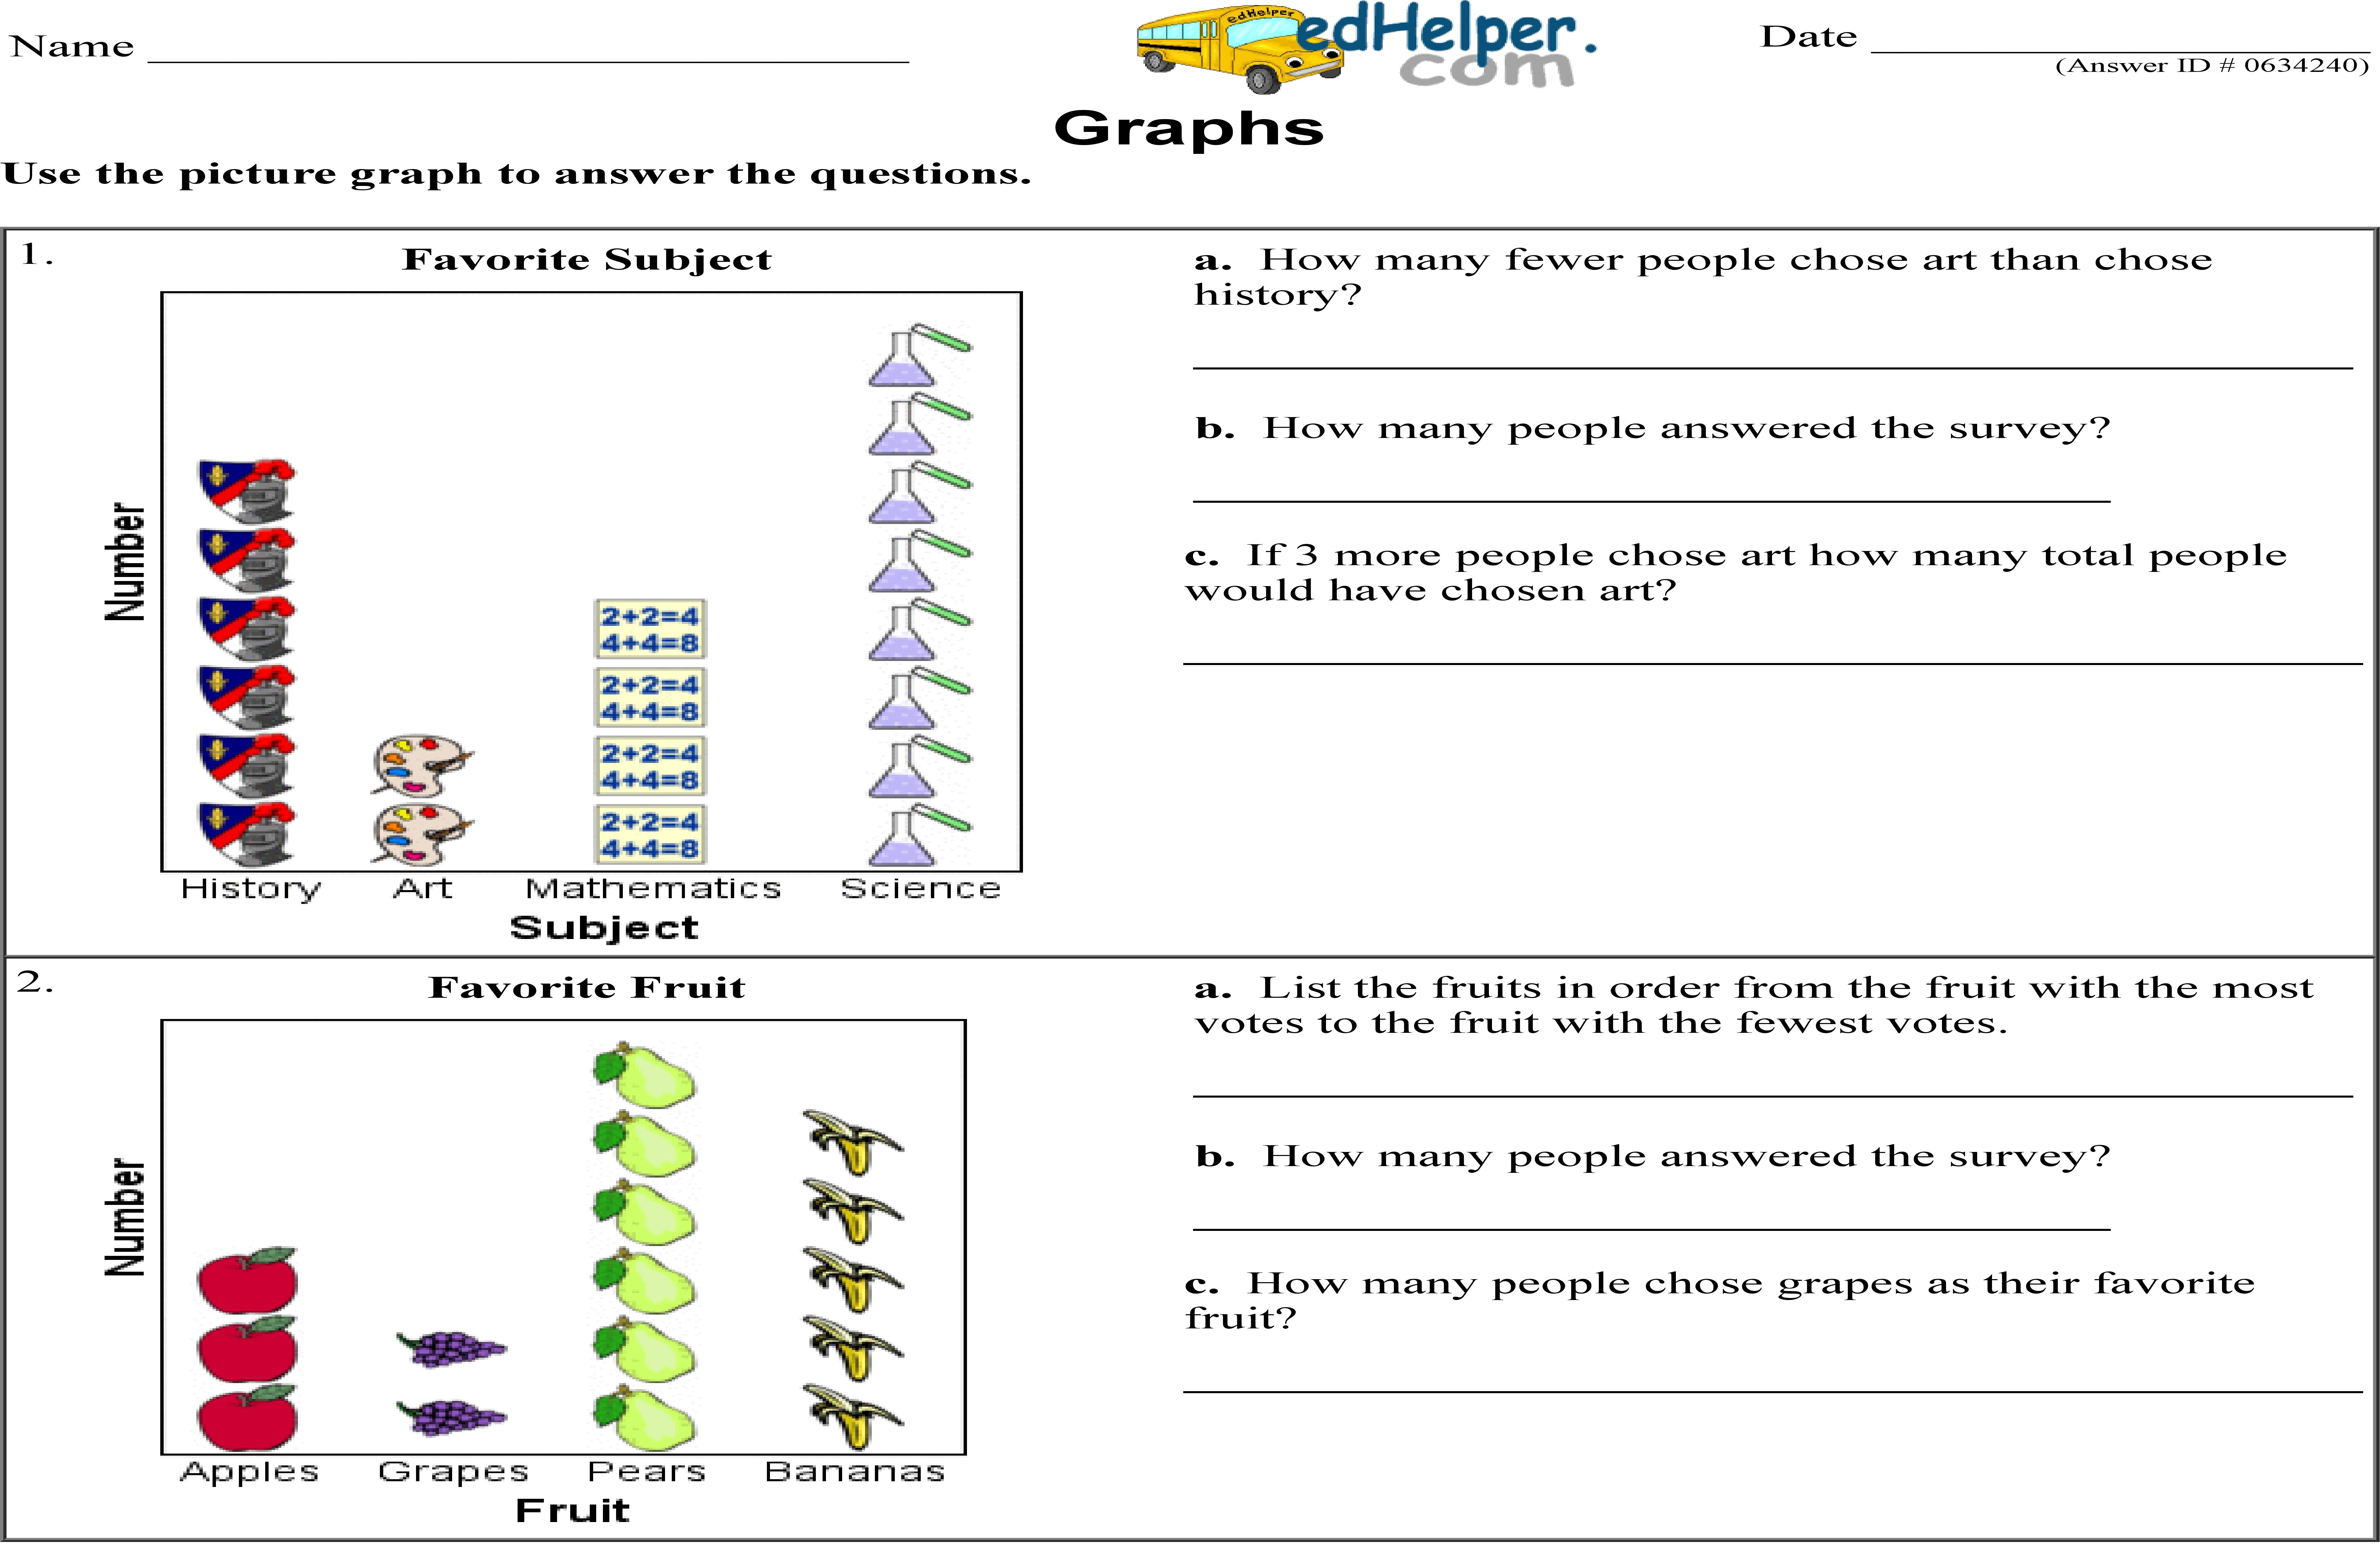
This math worksheet focuses on interpreting and analyzing picture graphs. It is divided into two main sections, each presenting a different graph with accompanying questions. One section could be a "Favorite Subject" graph, prompting students to determine how many more people favored writing over music, which subject was more popular between music and history, and identify the least popular subject. Each of these questions encourages students to engage with the graphs to extract and compare data effectively.
Analyzing Picture Graphs: Favorite Subjects and Seasons
Analyzing Picture Graphs: Favorite Subjects and Seasons
GRADES:


Additional Educational Resources:
Picture Graphs and Bar Graphs Large Workbook - (Grade 1)
Using Bar Models: Addition and Subtraction Large Workbook - (Grade 2)
Quick Assessment - Picture Graphs and Tally Charts