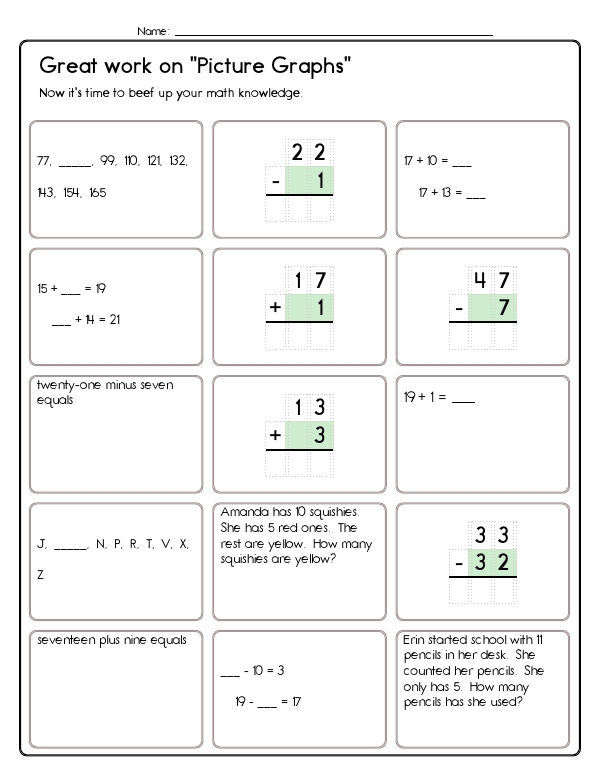
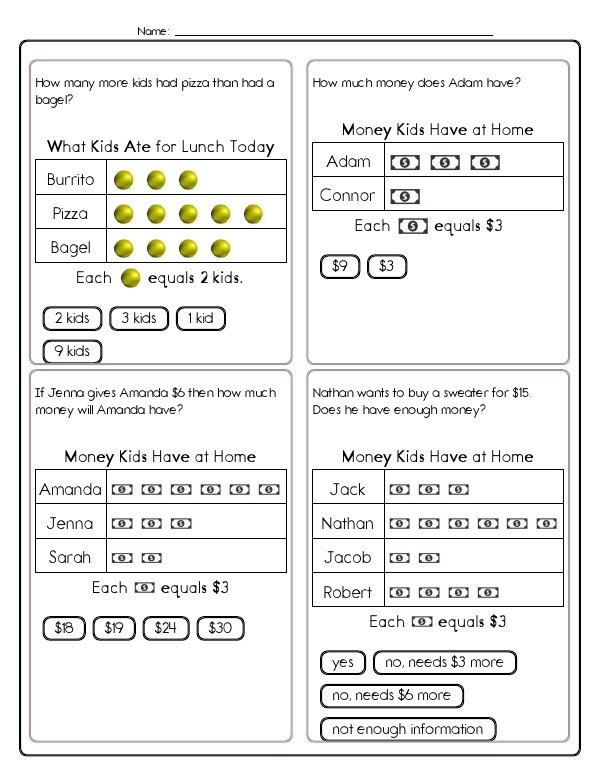
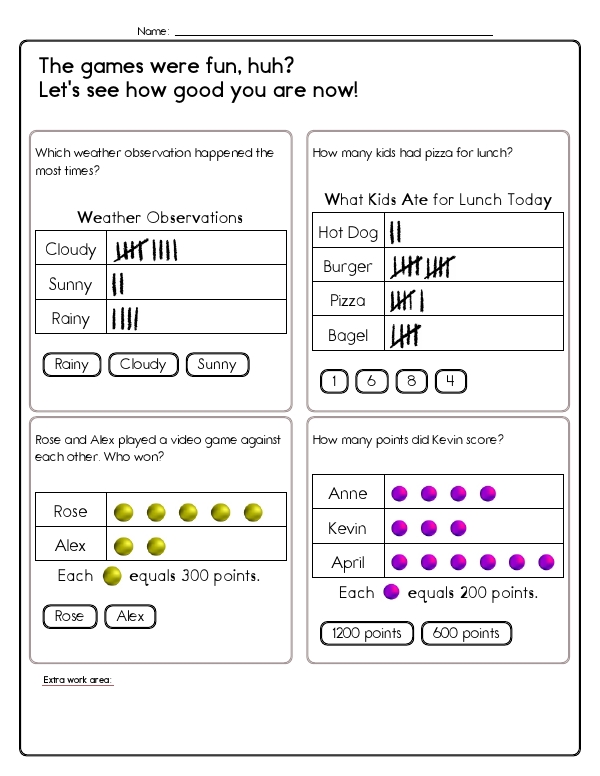
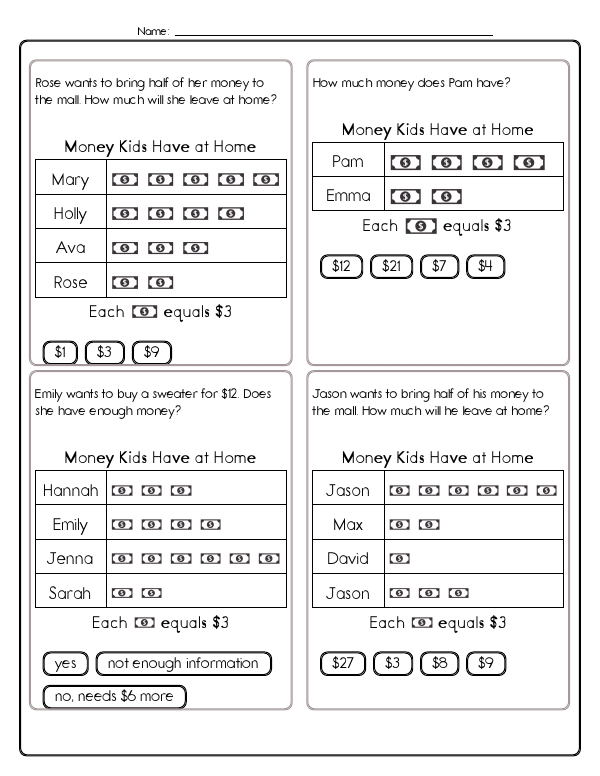
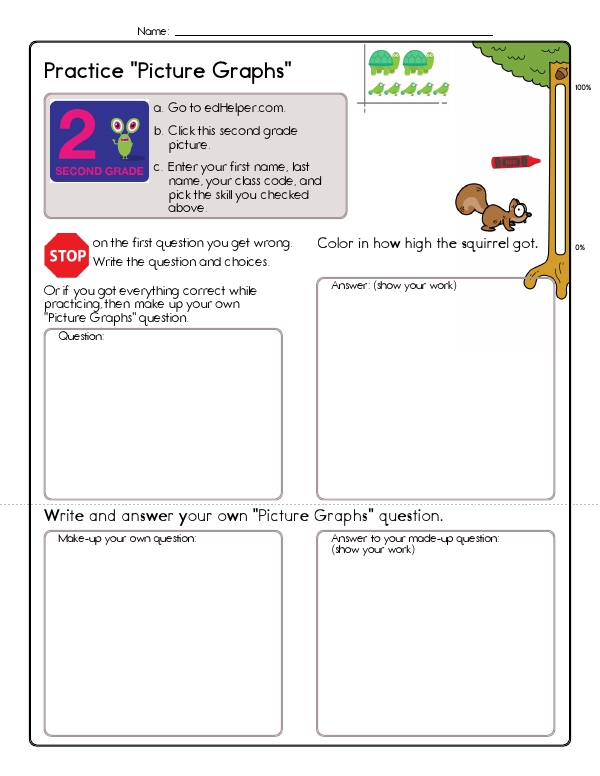
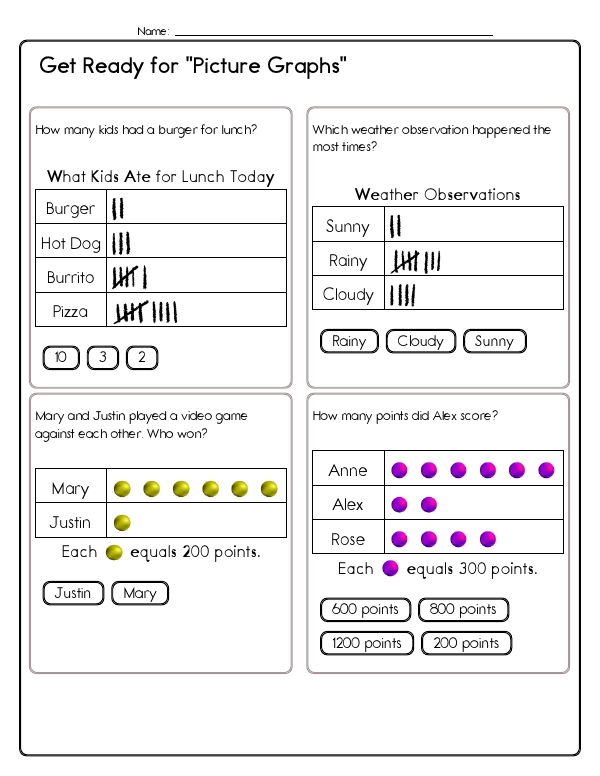
This math assessment workbook challenges kids to read and interpret data from picture graphs and tally charts. On each page, children answer multiple-choice questions that require them to identify the greatest or least category, count totals, compare two quantities, and solve one- and two-step word problems such as "How many more kids chose pizza than burgers?" or "Does Anna have enough money to buy a sweater?" Students need to show that they understand the symbol on each graph. Symbols in problems include "one dot equals two kids" or "one bill equals four dollars." This workbook will strengthen kids' number sense, data analysis, and logical reasoning.
Quick Assessment - Picture Graphs and Tally Charts
Additional Educational Resources:
Picture Graphs Large Workbook - (Grade 2)
Money Large Workbook - (Grade 2)
Quick Assessment - Introduction to Money: Fun with Coins and Bills
Quick Assessment - Picture Graphs and Tally Charts
Unlock Math Potential: Over 8 Pages in One Complete WorkbookGRADES:
Additional Educational Resources:
Picture Graphs Large Workbook - (Grade 2)
Money Large Workbook - (Grade 2)
Quick Assessment - Introduction to Money: Fun with Coins and Bills