
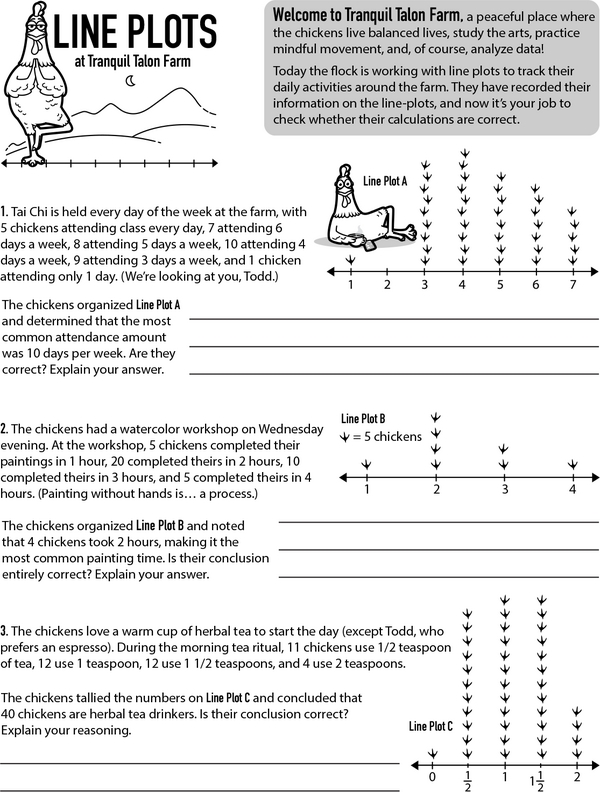
At Tranquil Talon Farm, the flock takes their wellness seriously. They keep detailed records and use line plots to display the results. But when it comes to drawing conclusions from these line plots, the flock is flustered! Can you help them out?
A line plot shows data along a number line. Each mark above a number shows how many times that value occurs. A typical line plot uses an X as a mark, but the line plots at Tranquil Talon Farm use a chicken paw instead. Now, study each line plot closely and read the flock's interpretation. Are they correct? Explain your answer.
Counting Clucks: Reading Line Plots
Additional Educational Resources:
Bar Graphs and Line Plots Large Workbook - (Grade 3)
Real-World Problems: Measurement Large Workbook - (Grade 3)
All Aboard: Bus Stop Challenge
Survey Says: Bar Graph Fun - Exploring Sports Preferences
Game On: Mastering Fractions
Counting Made Easy: Hundreds, Tens, and Ones
Counting Clucks: Reading Line Plots
GRADES:
Additional Educational Resources:
Bar Graphs and Line Plots Large Workbook - (Grade 3)
Real-World Problems: Measurement Large Workbook - (Grade 3)
All Aboard: Bus Stop Challenge
Survey Says: Bar Graph Fun - Exploring Sports Preferences
Game On: Mastering Fractions
Counting Made Easy: Hundreds, Tens, and Ones