
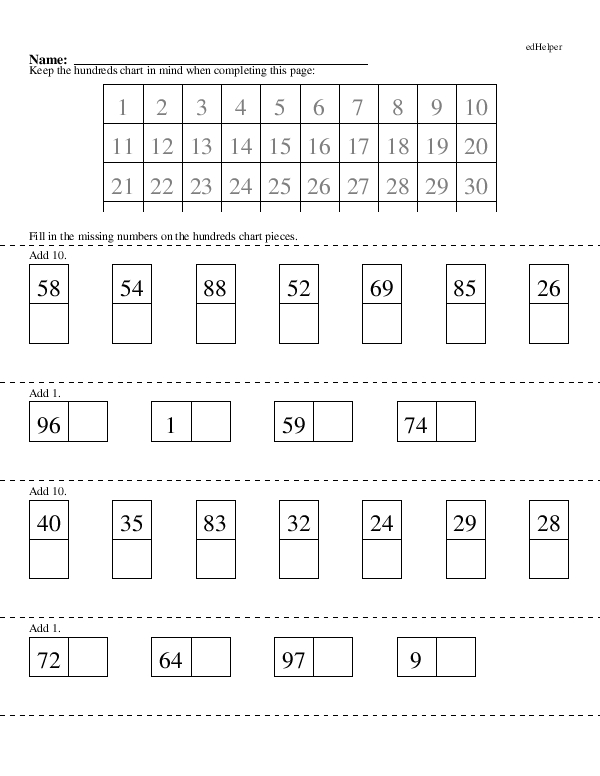
The worksheet titled "Find One More, One Less and Ten More, Ten Less: Hundreds Chart Activity" helps students think about numbers in a visual way by asking them to think about the hundreds chart when solving the problems. Lower grade level worksheets show the top part of the hundreds chart to remind students to think of the chart or locate the chart before beginning the activity, if it is hung up in your classroom.
Subsequent questions display a number in a box with an empty box to the right, left, below, or above the number. Where the box is located will indicate whether the next number is a 1 or a 10 and whether it's added or subtracted.
For example, lower-level worksheets include instructions such as "Add 10," "Add 1," and "Add 1 or 10" for addition problems, as well as "Subtract 10" or "Subtract 1" for subtraction problems. As the worksheet progresses, problems get more difficult with multiple boxes above, below, and to the sides of one or two numbers that are filled in. These problems do not come with instructions, so students have to figure out whether to add or subtract to find the number in each box.
Using a hundreds chart when adding and subtracting can help students build a stronger sense of numbers and their relationships, in addition to supporting counting skills and solidifying place value concepts. You can encourage them to think about the hundreds chart when adding and subtracting by giving students problems that mimic the setup of numbers in the chart.
For example, very young students could be given a number in a box with an empty box to the right. They add one and fill in the missing number. As students become more skilled, they can fill in an empty box to the left when subtracting one, on the bottom when adding ten, and on the top when subtracting ten. Older students can fill in groups of boxes, adding and subtracting ones and tens to fill in the mixed numbers.
You can start by displaying a hundreds chart in the classroom that students can refer to while completing math problems. Eventually, you can remove the chart and ask students to visualize the chart in their minds when completing problems.
Find One More, One Less and Ten More, Ten Less: Hundreds Chart Activity
Find One More, One Less and Ten More, Ten Less: Hundreds Chart Activity
GRADES:


Additional Educational Resources:
Numbers to 1,000 Large Workbook - (Grade 2)
Numbers to 100 Large Workbook - (Grade 1)
Quick Assessment - Place Value and Large Numbers: Quick Drills to Master BIG Numbers