
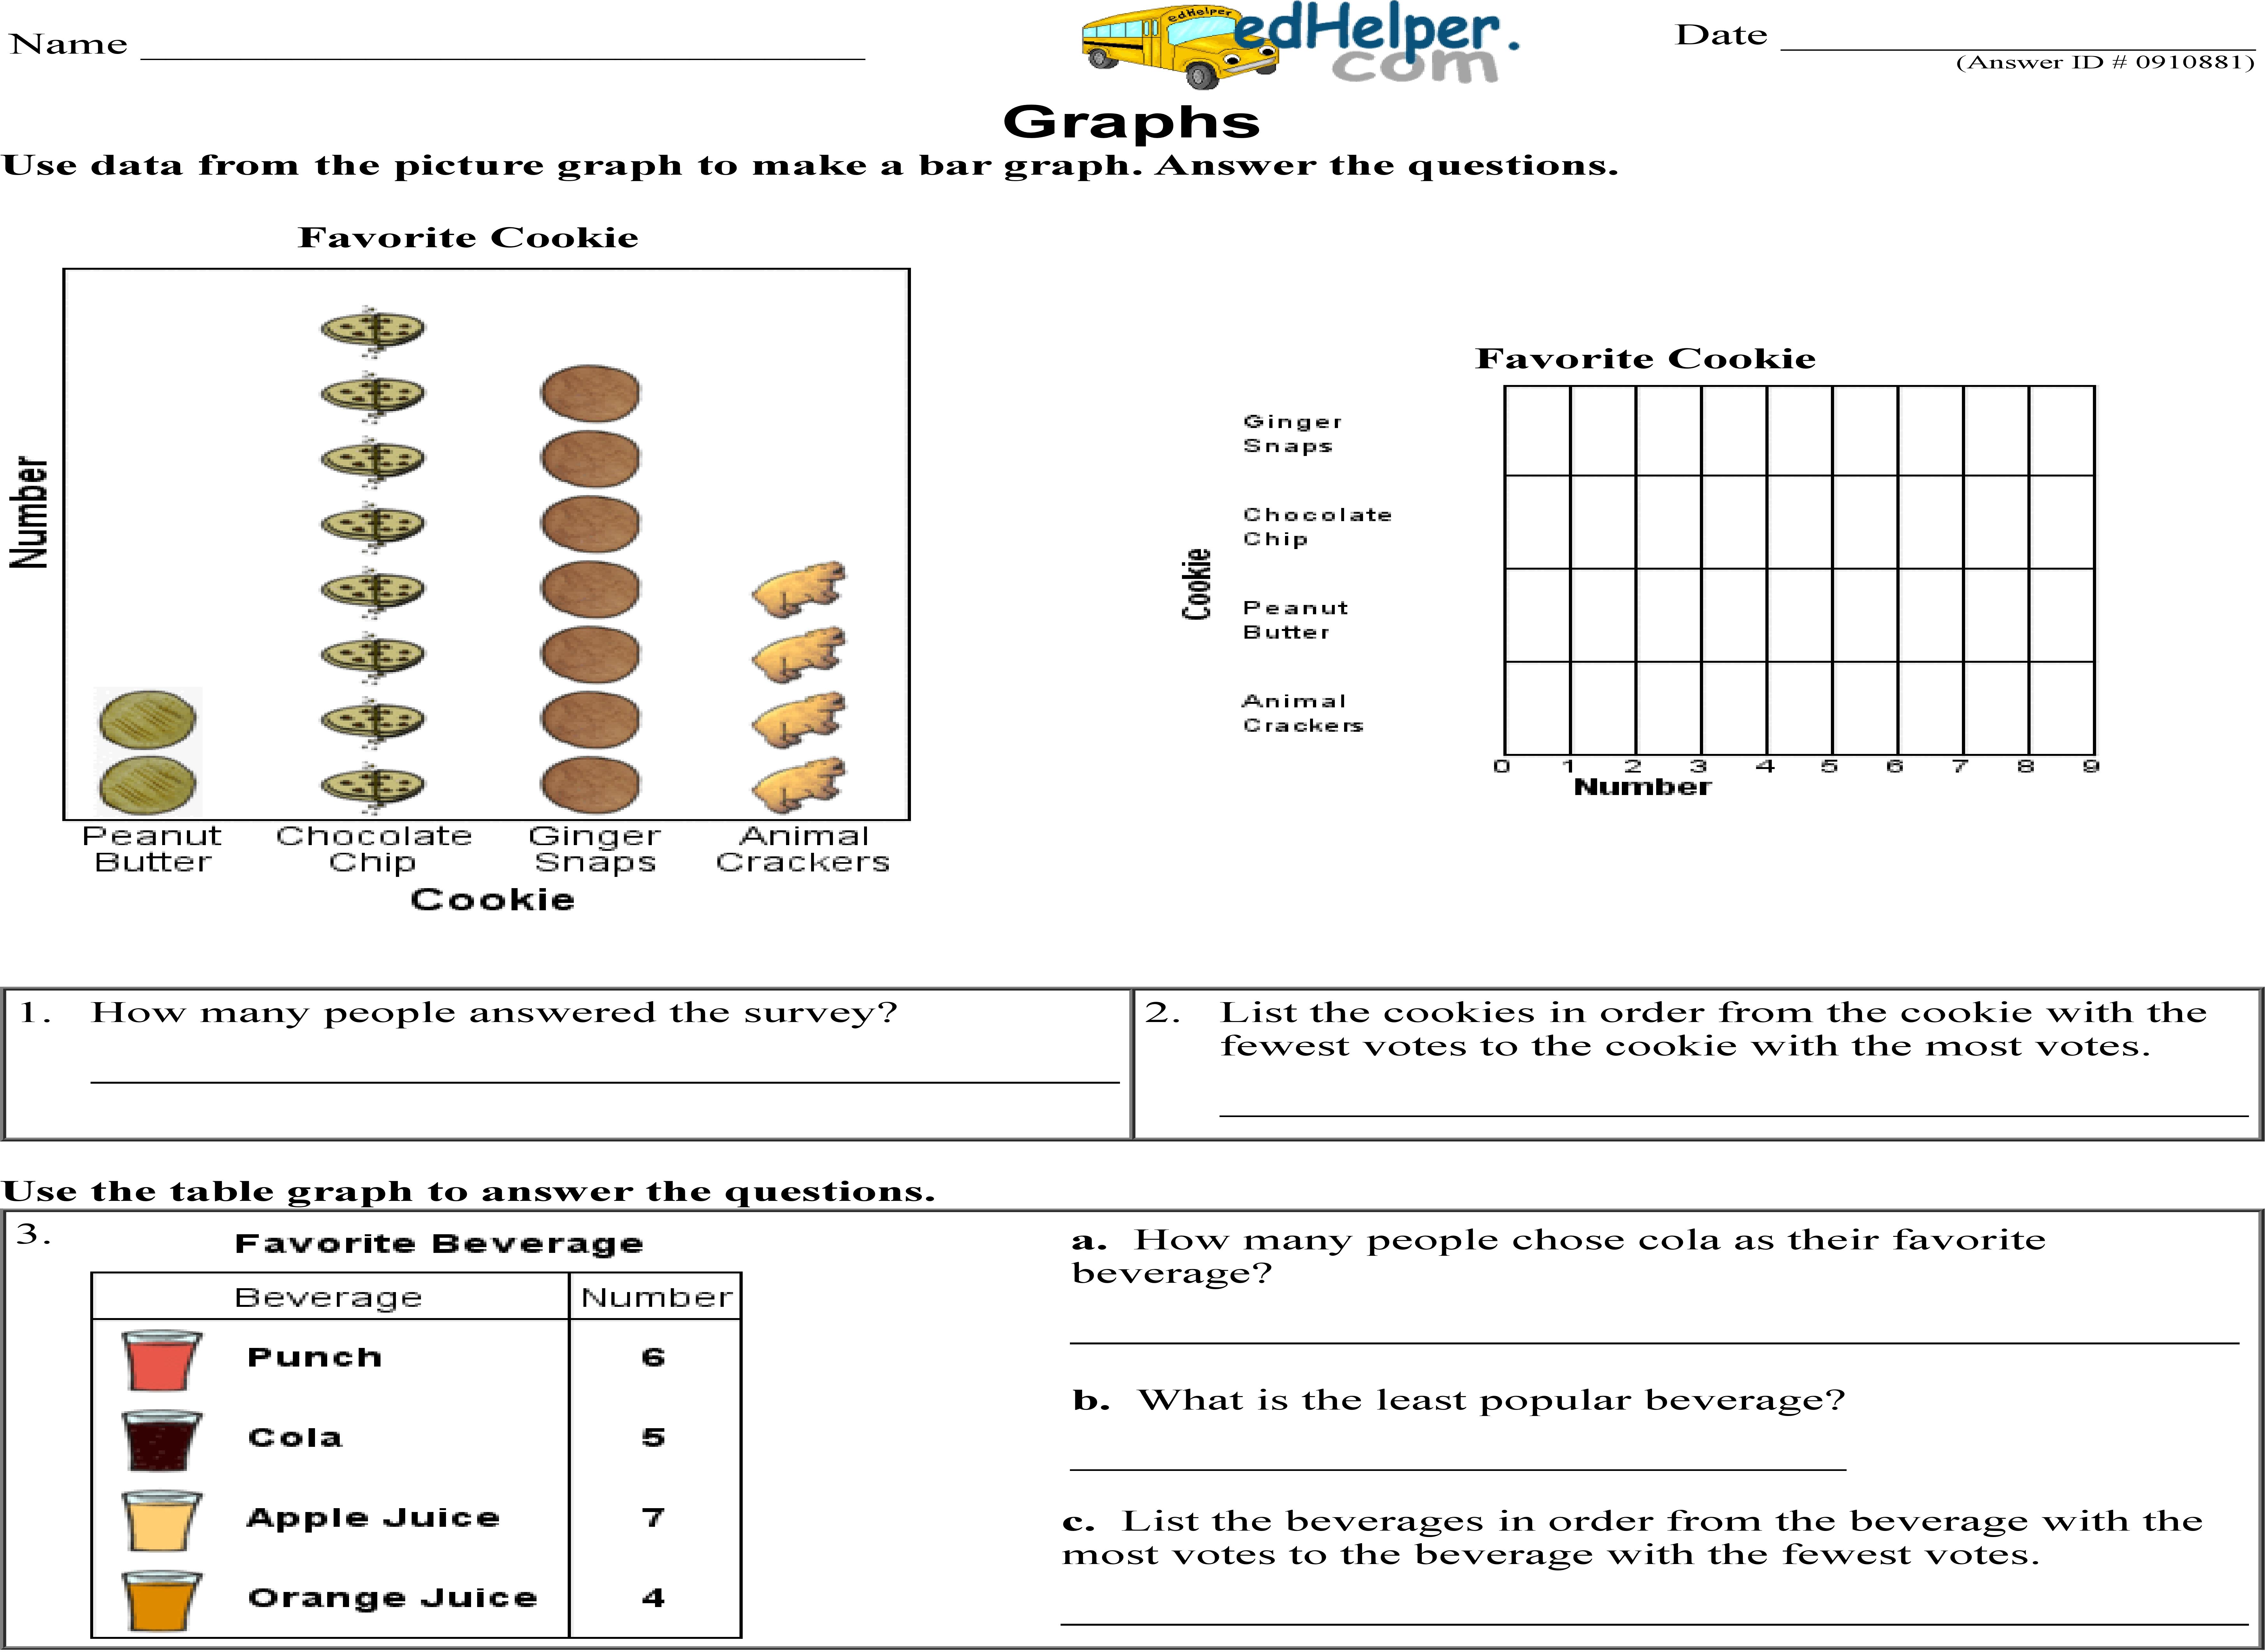
The math worksheet involves interpreting data from various types of graphs, including picture graphs, bar graphs, and tally tables, to answer several questions. It guides students through exercises that require them to convert data from picture graphs into bar graphs. The worksheet asks students to identify the least and most popular choices from given data sets, calculate differences in preferences for various categories such as favorite fruits, animals, seasons, cookies, and vegetables, and sum up specific selections. It challenges students to analyze graphs and tables, determine quantities associated with each category, and understand how to organize data efficiently and accurately.
Graph Mastery: Exploring Picture, Tally, and Bar Graphs
Additional Educational Resources:
Using Bar Models: Addition and Subtraction Large Workbook - (Grade 2)
Using Bar Models: Addition and Subtraction Large Workbook - (Grade 3)
Quick Assessment - Geometry Challenge - Shapes, Flips, and Turns
Quick Assessment - Discover Graphs: Picture Graphs and Bar Graphs
Graph Mastery: Exploring Picture, Tally, and Bar Graphs
GRADES:

Additional Educational Resources:
Using Bar Models: Addition and Subtraction Large Workbook - (Grade 2)
Using Bar Models: Addition and Subtraction Large Workbook - (Grade 3)
Quick Assessment - Geometry Challenge - Shapes, Flips, and Turns
Quick Assessment - Discover Graphs: Picture Graphs and Bar Graphs