

A histogram is a bar graph that shows how data is spread across equal ranges. It also happens to be the go-to tool at Graham's Graham Cracker Co. Study the example carefully, then organize the three data sets and turn them into easy-to-understand histograms!
Histogram Factory: Graham's Data Crunch
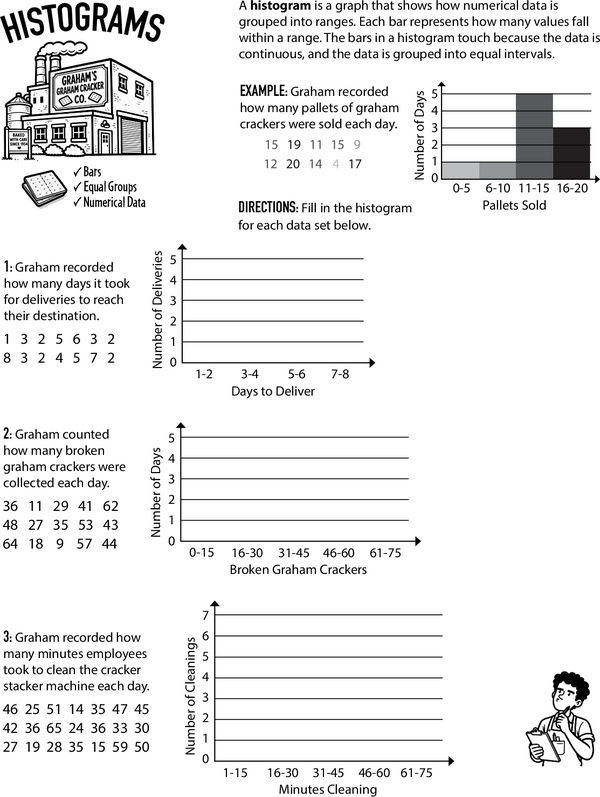
Histogram Factory: Graham's Data Crunch
GRADES:
Additional Educational Resources:
Data Large Workbook - (Grade 6)
Statistics Large Workbook - (Grade 6)
Calculating Unit Prices - Understanding Item Pricing at the Merchandise Stand
Unlocking the GCF: A Prime Factor Adventure
Type Of Quadrilaterals
Multiply to Double: Everyday Word Problems