
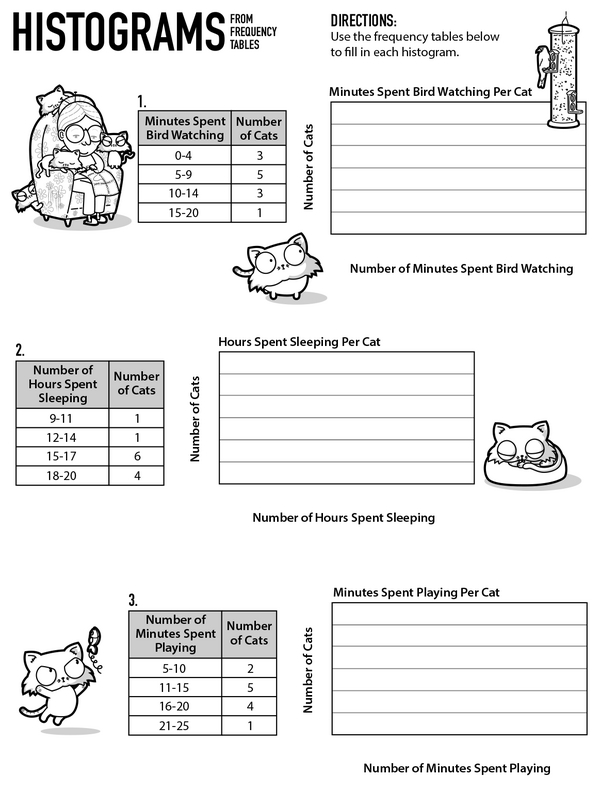
Cats love bird watching, taking naps, and playing. Check out the data collected for each activity. Can you convert the frequency tables into histograms?
A histogram helps you see patterns in numbers. Each bar represents a range of values (called a bin) and tells you how many data points fall within it. The bars are drawn next to each other, making it easy to see the patterns in the data. Ready to uncover the secrets of cats? Let histograms show you!
Meow-tastic Data: Explore Histograms
Additional Educational Resources:
Statistics Large Workbook - (Grade 6)
Data Large Workbook - (Grade 6)
Puzzling over Heights: A Triangle Challenge
Make Them Equivalent: Ratio Puzzles
Mastering the Coordinate Plane and Its Quadrants: Safeguarding Your Spaceship from Asteroids
Mapping Pepper's Snack Hunt: Learn Coordinates on a Grid
Meow-tastic Data: Explore Histograms
GRADES:
Additional Educational Resources:
Statistics Large Workbook - (Grade 6)
Data Large Workbook - (Grade 6)
Puzzling over Heights: A Triangle Challenge
Make Them Equivalent: Ratio Puzzles
Mastering the Coordinate Plane and Its Quadrants: Safeguarding Your Spaceship from Asteroids
Mapping Pepper's Snack Hunt: Learn Coordinates on a Grid