
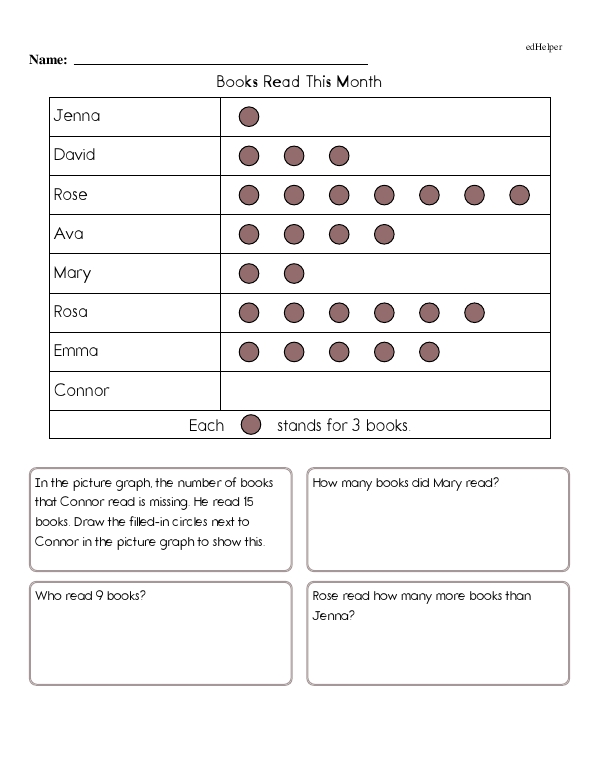
"Reading Picture Graphs and Answering Questions About Books Read in One Month" is a worksheet that features a picture graph at the top of the page. It shows how many books each student has read. The names of the students are listed on the left, and filled-in circles are listed on the right. How much each circle is worth is indicated under the graph. For example, on one graph, each filled-in circle is worth 3 books.
Questions are listed underneath each graph. Every page starts with the same problem. It shares how many books one of the kids read, and students have to draw the filled-in circles next to that name in the graph.
Additional questions ask students to identify how many books a specific person read, who read a particular number of books, and how many more books one student read compared to another student.
Each page features four questions in the same format to provide students with repetitive practice. Each question is located in a rectangular box so students can write their answers clearly.
Learning how to read graphs is an important skill because it teaches students problem-solving and decision-making in math and real-world applications. It also teaches them how to visualize and compare data easily, which are important skills in higher grade levels.
Picture graphs are a good place to start with young students because they can easily see what the information represents. To give them a bigger challenge, have students create a graph where each picture stands for more than one. For example, they could poll their classmates about their favorite animal, but instead of each dot on the graph representing one, it could represent two students who like the same animal.
Creating graphs and answering questions can also be an independent activity in class. For example, students could graph how many different colored straws are in a basket. Then, they can answer questions about the straws, like how many more there are of one color compared to another.
Reading Picture Graphs and Answering Questions About Books Read in One Month
Reading Picture Graphs and Answering Questions About Books Read in One Month
GRADES:
Additional Educational Resources:
Using Bar Models: Addition and Subtraction Large Workbook - (Grade 2)
Addition and Subtraction Facts to 20 Large Workbook - (Grade 1)
Quick Assessment - Easy Addition and Subtraction to 20