
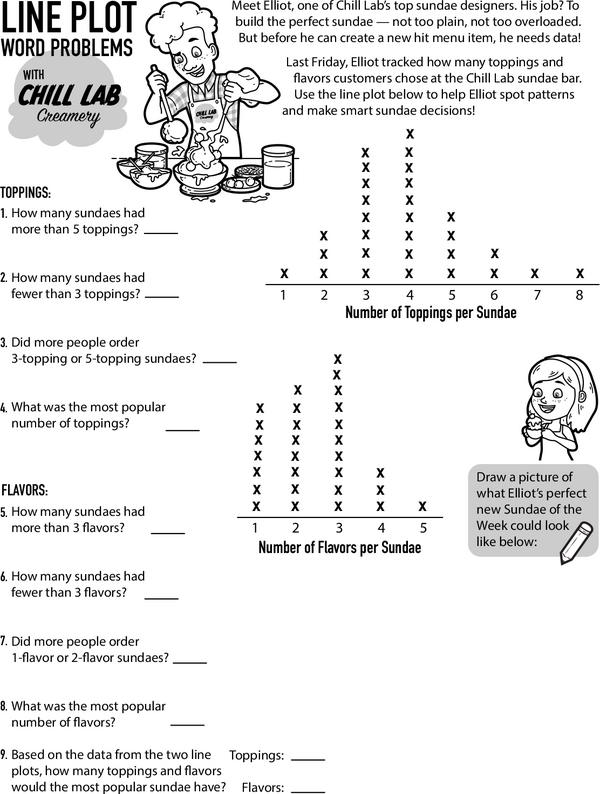
Data talks! Check out these two line plots Elliot collected last Friday. One tracks toppings, and the other tracks flavors. Analyze the data, answer the questions, and help Elliot design the next Sundae of the Week!
A line plot shows how many times something happens. It helps us see patterns and compare things easily. Imagine you want to know how many toppings people like on their sundaes. You draw a line and put an X above each number of toppings. More Xs mean more people like that amount. Now that you know how to read a line plot, help Elliot figure out the next Sundae of the Week!
Sundae Stats: Line Plot Word Problems
Additional Educational Resources:
Real-World Problems: Measurement Large Workbook - (Grade 3)
Bar Graphs and Line Plots Large Workbook - (Grade 3)
Quick Assessment - Discover Graphs: Picture Graphs and Bar Graphs
A Deep Dive into Pictographs: Granny's Garden
Solving Word Problems with Multiplication Area Models
Money Match-Up: Add and Compare
Math in Action: Measuring Areas, Tracking Time
Crayon Math: Subtract and Shade
Graph It Out: Exploring Line Plots
Sundae Stats: Line Plot Word Problems
GRADES:
Additional Educational Resources:
Real-World Problems: Measurement Large Workbook - (Grade 3)
Bar Graphs and Line Plots Large Workbook - (Grade 3)
Quick Assessment - Discover Graphs: Picture Graphs and Bar Graphs
A Deep Dive into Pictographs: Granny's Garden
Solving Word Problems with Multiplication Area Models
Money Match-Up: Add and Compare
Math in Action: Measuring Areas, Tracking Time
Crayon Math: Subtract and Shade
Graph It Out: Exploring Line Plots