
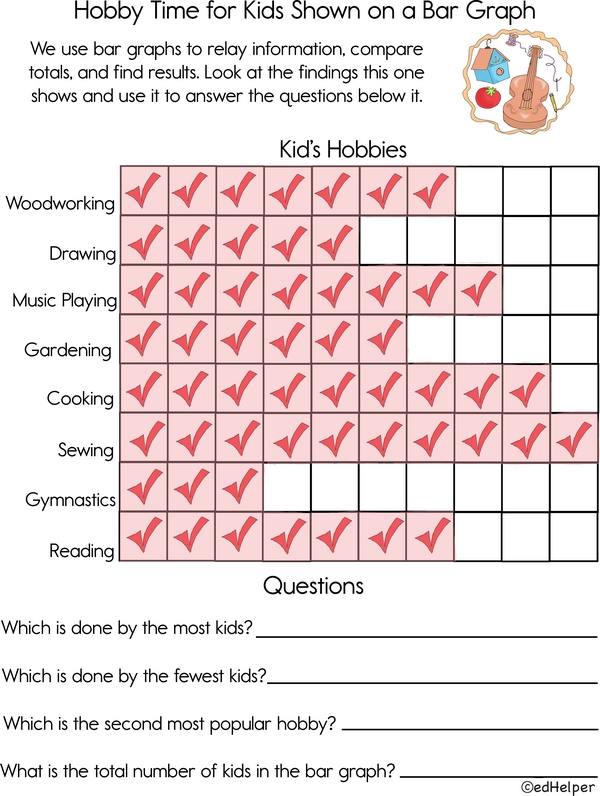
What do these kids like to do as hobbies? Look at the bar graph to see the results, then answer the questions.
A bar graph is a visual tool for organizing and comparing data. The longer the bar, the bigger the number. Now, follow the directions and complete the challenge.
Survey Says: A Bar Graph on Hobbies
Additional Educational Resources:
Bar Graphs and Line Plots Large Workbook - (Grade 3)
Real-World Problems: Measurement Large Workbook - (Grade 3)
Rounding Numbers: From Tens to Hundreds
Time to Regroup: Add Them Up
Three and Four-digit Division with Remainders - Fishy Division Riddle
Triple Plays: Rounding, Expanding, and Building Numbers
Survey Says: A Bar Graph on Hobbies
GRADES:
Additional Educational Resources:
Bar Graphs and Line Plots Large Workbook - (Grade 3)
Real-World Problems: Measurement Large Workbook - (Grade 3)
Rounding Numbers: From Tens to Hundreds
Time to Regroup: Add Them Up
Three and Four-digit Division with Remainders - Fishy Division Riddle
Triple Plays: Rounding, Expanding, and Building Numbers